Grade 9 · Box Plots & Quartiles
Grade 9 Box Plots Worksheets
Printable Grade 9 box plots worksheets, sized to fit one page. Download a free sample below, or pick beginner, intermediate, or advanced and generate a fresh pack with answer keys in seconds. No AI, no wrong answers.
Free to start · answer keys included · free accounts get 5 Standard packs to use within 14 days · no card required.
Grade 9 examples by level
Use the data list or the box plot to answer each question.
- BeginnerDaily high temperatures (°C): 14, 15, 25, 26, 27, 28, 29, 32, 32. Find the interquartile range (IQR).Answer10.5
- IntermediateLower quartile (Q1) =Answer5
- AdvancedBooks read this term: 23, 24, 18, 24, 8, 17, 18, 7, 42. Is 42 an outlier? Use the 1.5 × IQR rule.AnswerYes: upper fence 41.25
Real problems from the generator: always mathematically correct, and every pack is different.
Download a free Grade 9 box plots worksheet
One page, ready to print, no account needed. Pick a level:
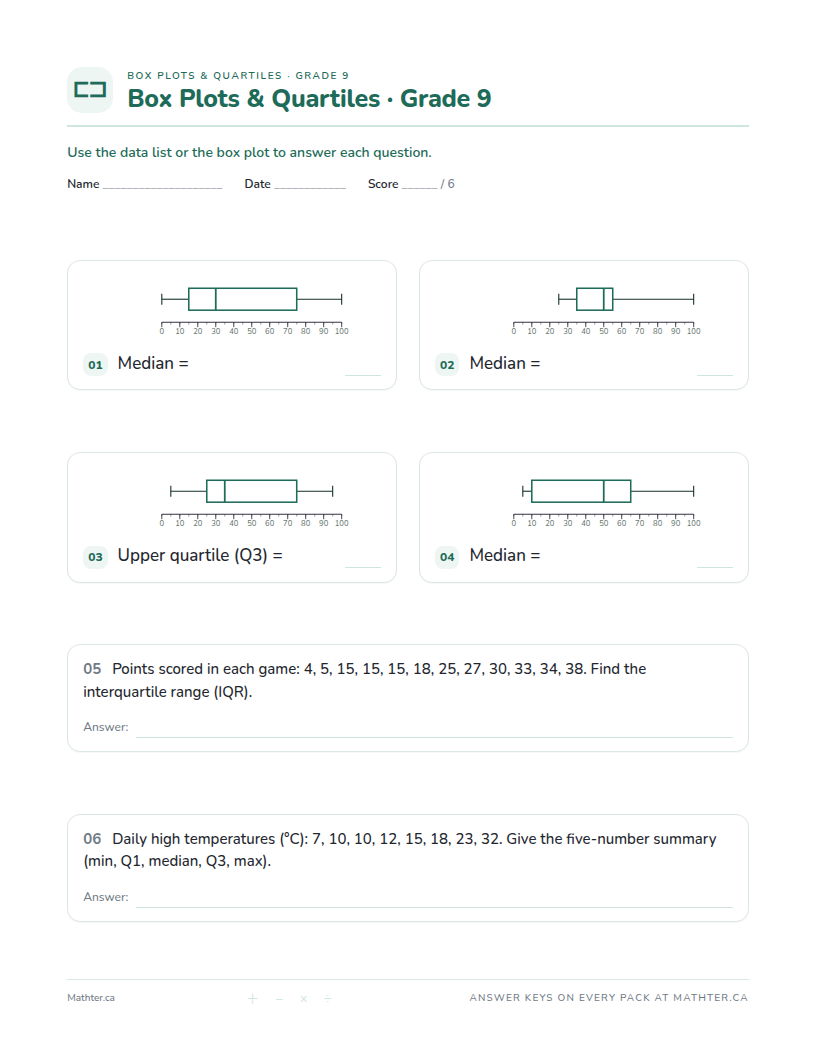
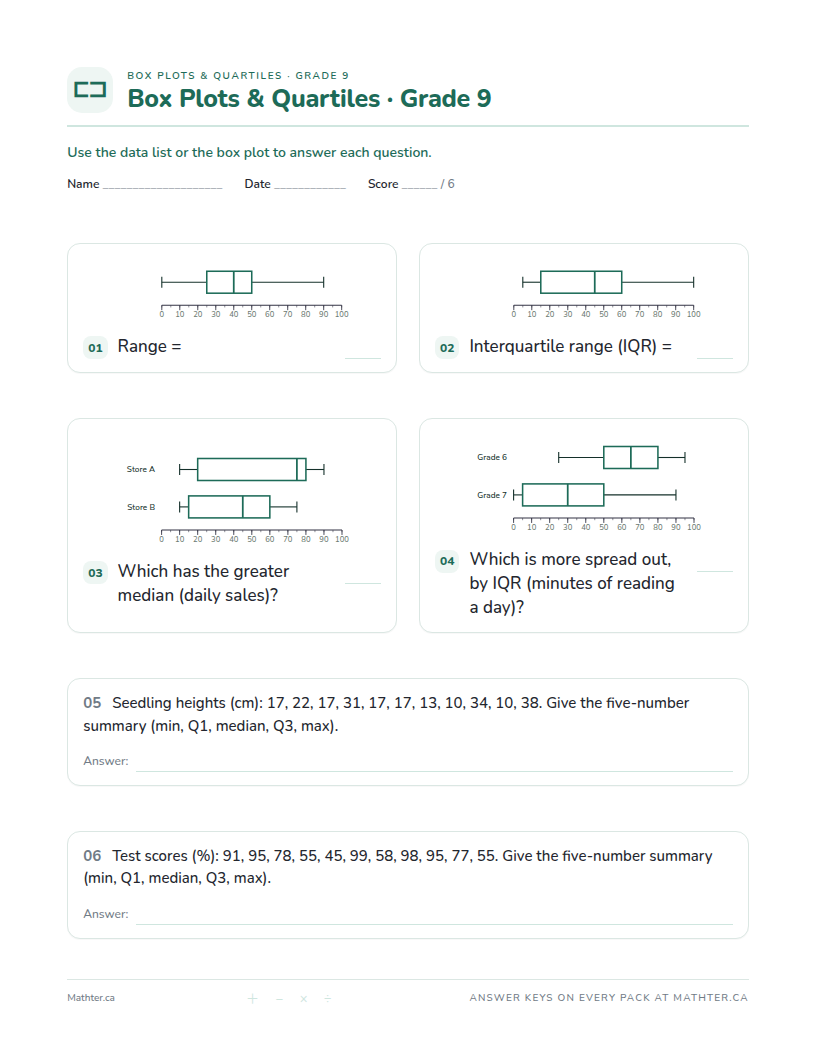
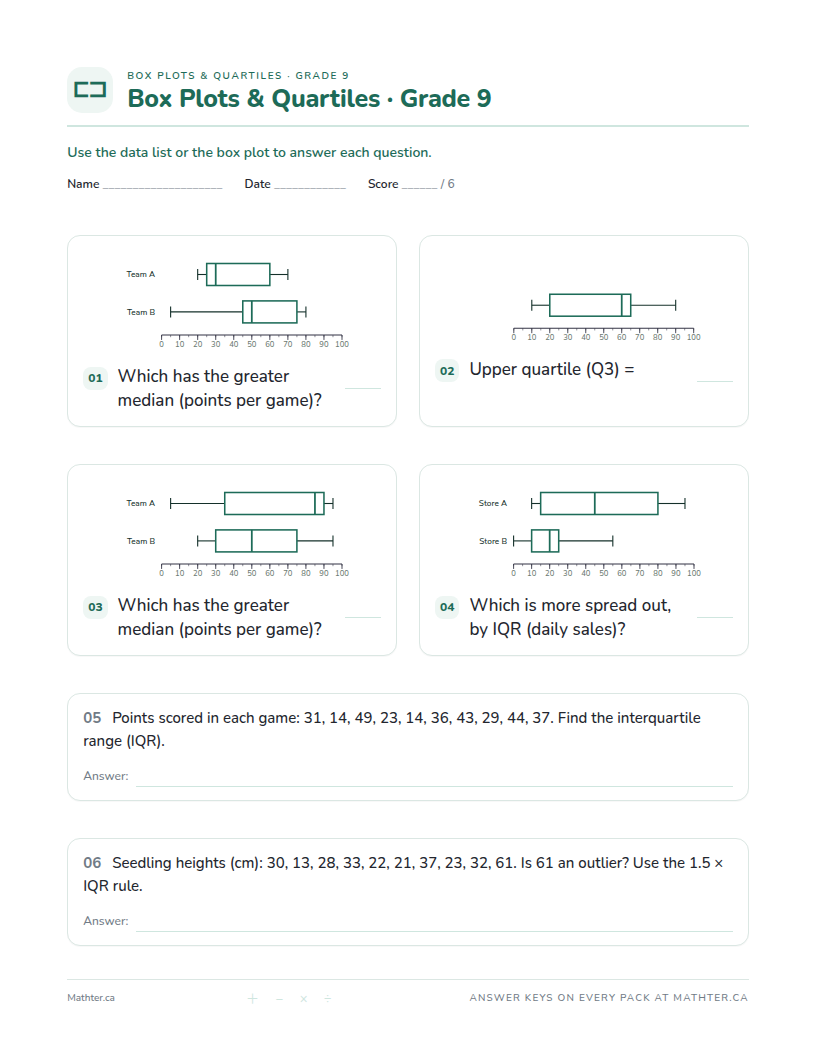
These three sheets are fixed, so you can bookmark or share them and get the same page back. Answer keys and fresh numbers come with a free account.
Why Grade 9 box plots practice matters
A box plot squeezes a whole data set into five numbers, so two groups can be compared at a glance: which is higher overall, and which is more spread out.
Grade 9 is the most advanced box plots practice Mathter offers, building on what's covered in Grade 7.
Want the full method, tips, and common mistakes? Read the Box Plot and Quartile Worksheets guide.
Frequently asked questions
- What's on a Grade 9 box plots worksheet?
- Each pack has up to 12 questions per page with a matching answer key, tuned to Grade 9, with beginner, intermediate, and advanced options so a teacher, tutor, or parent can match the learner's level.
- How do you find the quartiles?
- Sort the data and find the median. Q1 is the median of the lower half and Q3 of the upper half; leave the median out of both halves when the count is odd.
- What does the box show?
- The middle half of the data, from Q1 to Q3. Its length is the interquartile range (IQR).
Make a Grade 9 box plots pack
Pick your options and print in seconds, with answer keys included.
Create free worksheetsFree to start · answer keys included · free accounts get 5 Standard packs to use within 14 days · no card required.