Grade 7 · Box Plots & Quartiles
Grade 7 Box Plots Worksheets
Printable Grade 7 box plots worksheets, sized to fit one page. Download a free sample below, or pick beginner, intermediate, or advanced and generate a fresh pack with answer keys in seconds. No AI, no wrong answers.
Free to start · answer keys included · free accounts get 5 Standard packs to use within 14 days · no card required.
Grade 7 examples by level
Use the data list or the box plot to answer each question.
- BeginnerBooks read this term: 2, 5, 6, 8, 12, 16, 18, 19, 23. Find the median.Answer12
- IntermediatePoints scored in each game: 33, 39, 38, 47, 17, 37, 38, 41, 39, 42. Give the five-number summary (min, Q1, median, Q3, max).Answer17, 37, 38.5, 41, 47
- AdvancedWhich is more spread out, by IQR (daily sales)?AnswerStore B
Real problems from the generator: always mathematically correct, and every pack is different.
Download a free Grade 7 box plots worksheet
One page, ready to print, no account needed. Pick a level:
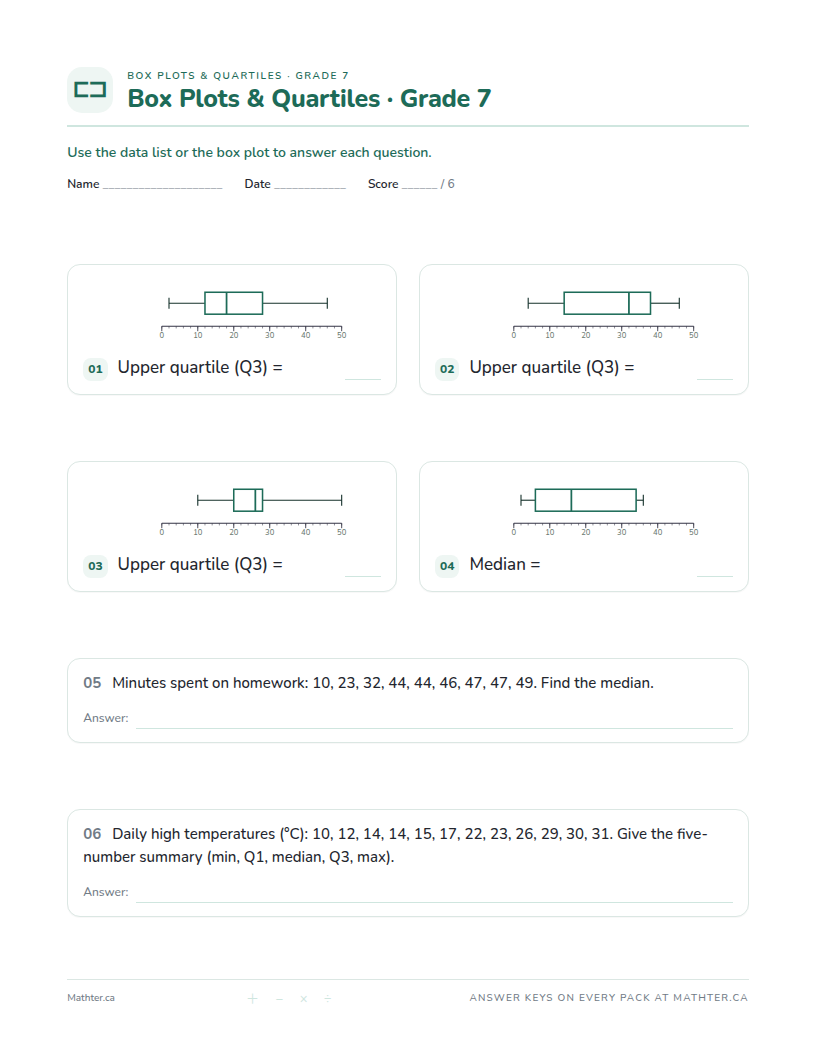
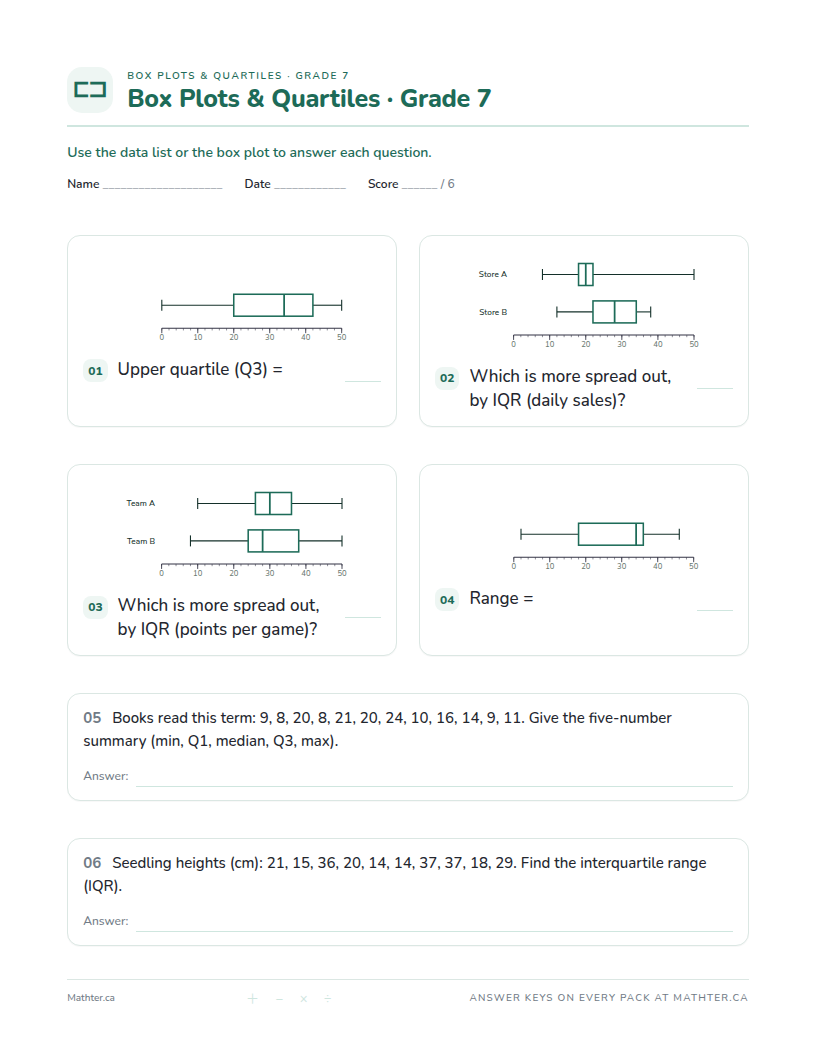
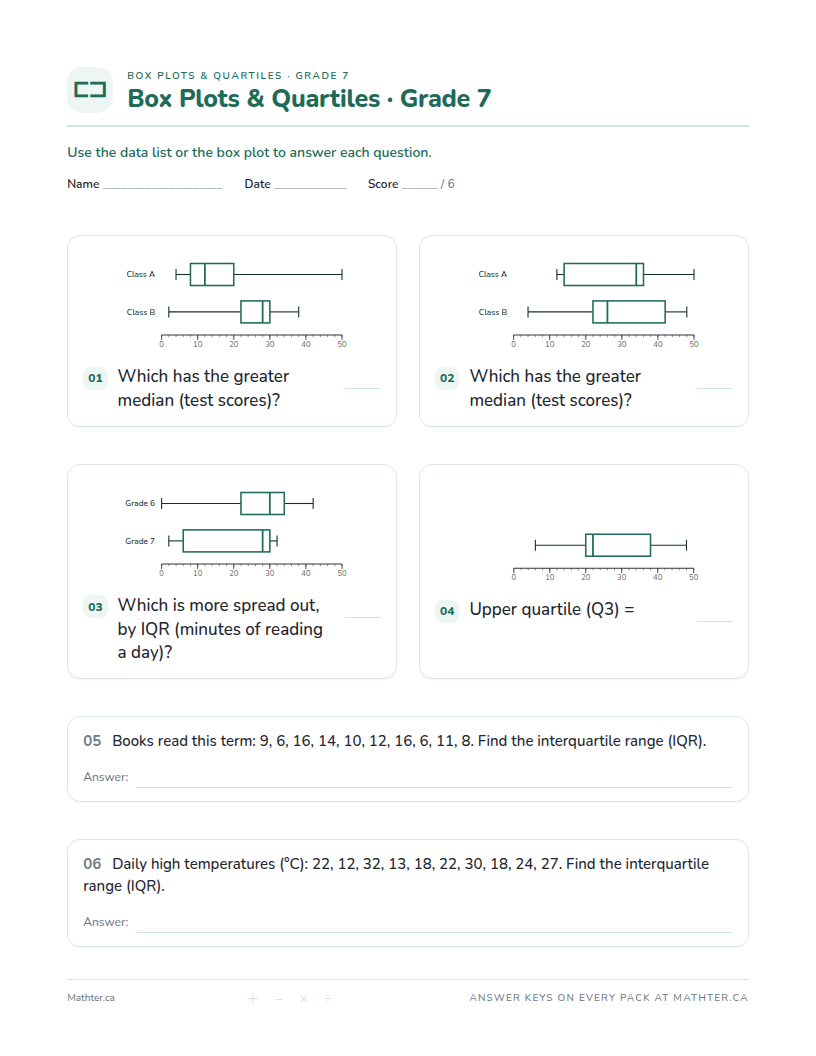
These three sheets are fixed, so you can bookmark or share them and get the same page back. Answer keys and fresh numbers come with a free account.
Why Grade 7 box plots practice matters
A box plot squeezes a whole data set into five numbers, so two groups can be compared at a glance: which is higher overall, and which is more spread out.
Grade 7 sits between Grade 6 and Grade 9 in Mathter's box plots sequence, building on the earlier grade before Grade 9 extends it further.
Want the full method, tips, and common mistakes? Read the Box Plot and Quartile Worksheets guide.
Frequently asked questions
- What's on a Grade 7 box plots worksheet?
- Each pack has up to 12 questions per page with a matching answer key, tuned to Grade 7, with beginner, intermediate, and advanced options so a teacher, tutor, or parent can match the learner's level.
- How do you find the quartiles?
- Sort the data and find the median. Q1 is the median of the lower half and Q3 of the upper half; leave the median out of both halves when the count is odd.
- What does the box show?
- The middle half of the data, from Q1 to Q3. Its length is the interquartile range (IQR).
Make a Grade 7 box plots pack
Pick your options and print in seconds, with answer keys included.
Create free worksheetsFree to start · answer keys included · free accounts get 5 Standard packs to use within 14 days · no card required.