Grade 8 · Scatter Plots & Best Fit
Grade 8 Scatter Plots Worksheets
Printable Grade 8 scatter plots worksheets, sized to fit one page. Download a free sample below, or pick beginner, intermediate, or advanced and generate a fresh pack with answer keys in seconds. No AI, no wrong answers.
Free to start · answer keys included · free accounts get 5 Standard packs to use within 14 days · no card required.
Grade 8 examples by level
Use each scatter plot, or the equation given, to answer the question.
- BeginnerPositive, negative or no correlation?AnswerNegative
- IntermediateWhich point is the outlier? Give its coordinates.Answer(22, 90)
- AdvancedWhich point is the outlier? Give its coordinates.Answer(4, 80)
Real problems from the generator: always mathematically correct, and every pack is different.
Download a free Grade 8 scatter plots worksheet
One page, ready to print, no account needed. Pick a level:
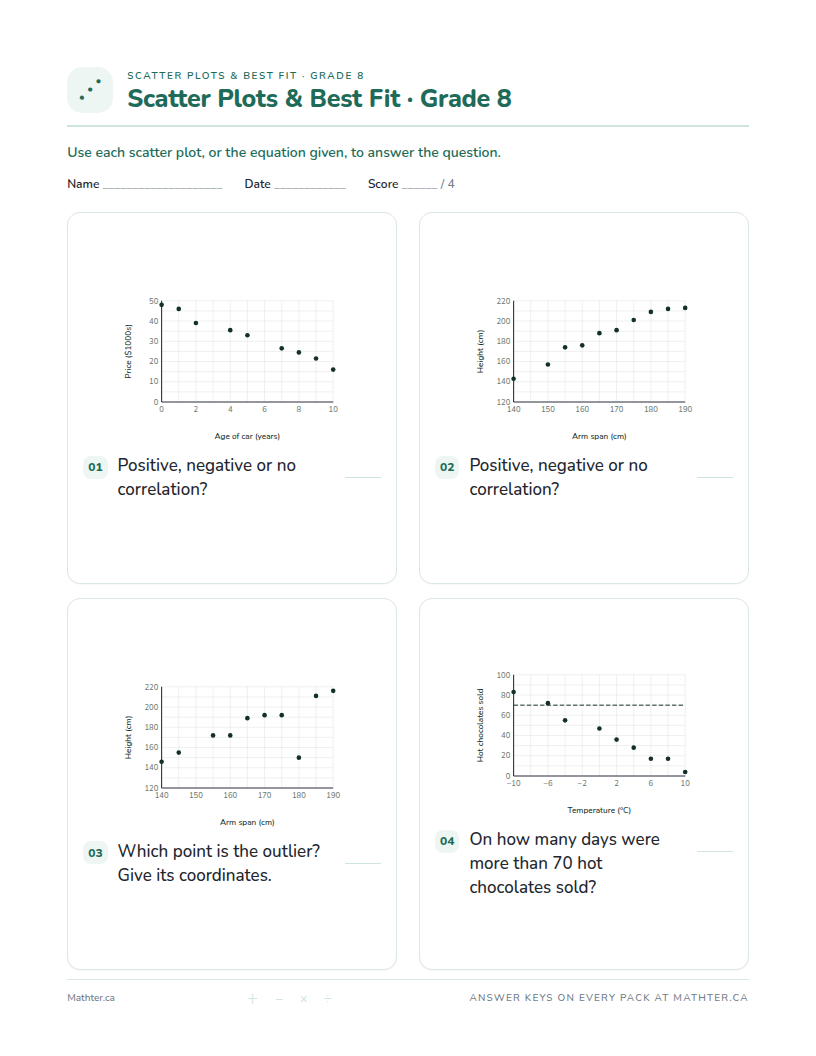
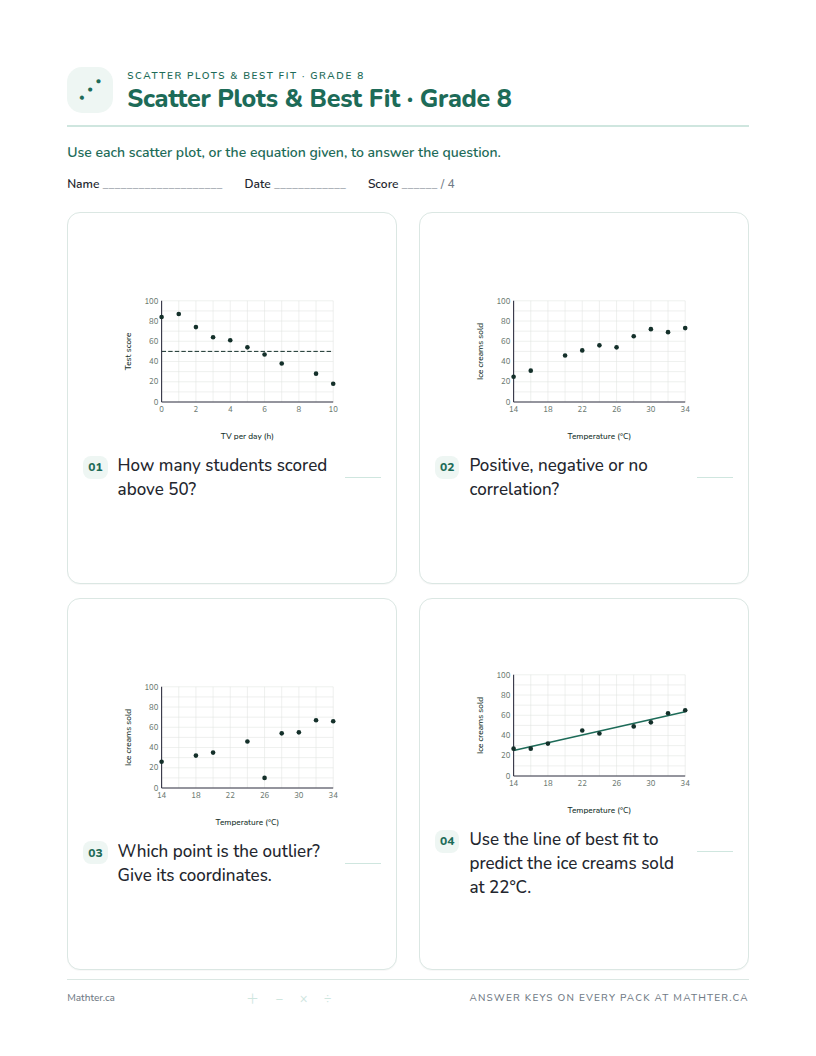
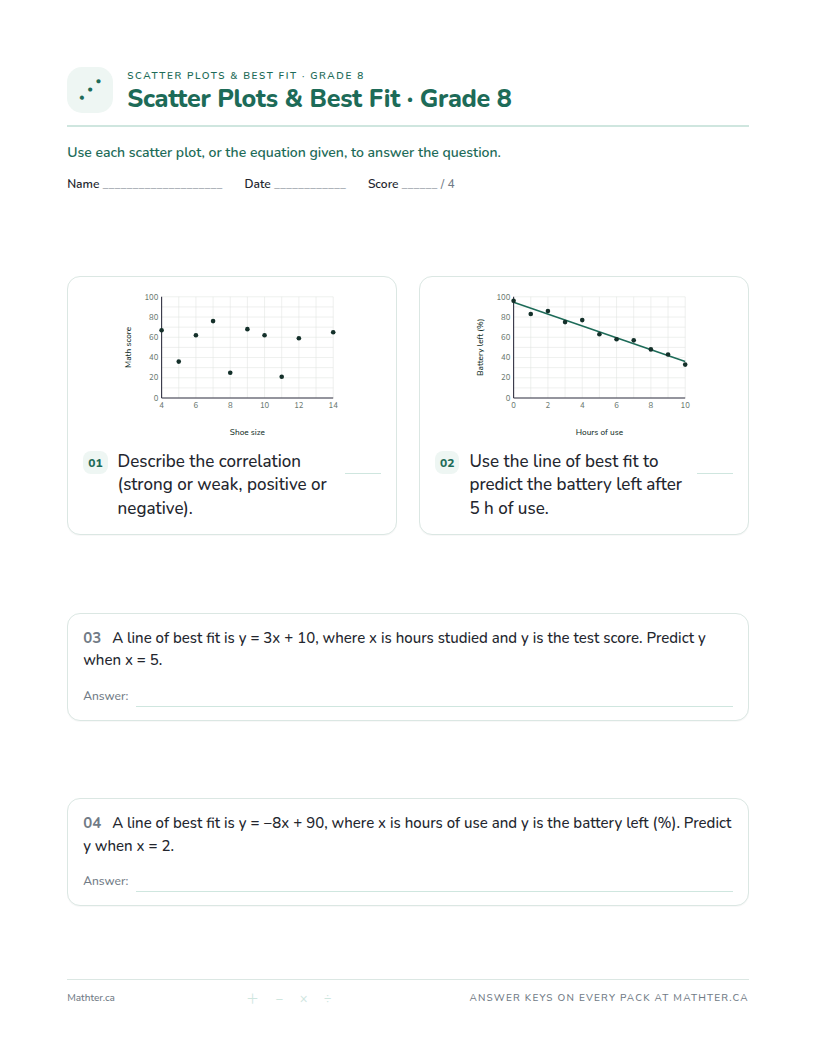
These three sheets are fixed, so you can bookmark or share them and get the same page back. Answer keys and fresh numbers come with a free account.
Why Grade 8 scatter plots practice matters
Scatter plots are how anyone checks whether two things are related, from sales and weather to sleep and grades. A line of best fit turns that pattern into a prediction.
Grade 8 is where Mathter's scatter plots worksheets first appear. Grade 9 picks up from here with more advanced problems.
Want the full method, tips, and common mistakes? Read the Scatter Plot and Line of Best Fit Worksheets guide.
Frequently asked questions
- What's on a Grade 8 scatter plots worksheet?
- Each pack has up to 12 questions per page with a matching answer key, tuned to Grade 8, with beginner, intermediate, and advanced options so a teacher, tutor, or parent can match the learner's level.
- What is a line of best fit?
- A straight line drawn through the middle of the points, with about as many above it as below, to show the trend.
- What's the difference between interpolation and extrapolation?
- Interpolation predicts inside the range of the data; extrapolation goes beyond it and is less reliable.
Make a Grade 8 scatter plots pack
Pick your options and print in seconds, with answer keys included.
Create free worksheetsFree to start · answer keys included · free accounts get 5 Standard packs to use within 14 days · no card required.