Grade 3 · Data & Graphs
Grade 3 Data & Graphs Worksheets
Printable Grade 3 data & graphs worksheets, sized to fit one page. Download a free sample below, or pick beginner, intermediate, or advanced and generate a fresh pack with answer keys in seconds. No AI, no wrong answers.
Free to start · answer keys included · free accounts get 14 days of Standard · no card required.
Grade 3 examples by level
- BeginnerUse the pictograph about apples picked at the orchard.Answera) 18 apples b) Room 5 c) 32 apples
- IntermediateUse the pictograph about jumps toward our class skipping goal.Answera) 15 jumps b) 10 jumps c) 90 jumps
- AdvancedUse the bar graph about birds seen at the feeder.Answera) 4 birds b) 3 birds c) 44 birds
Real problems from the generator: always mathematically correct, and every pack is different.
Download a free Grade 3 data & graphs worksheet
One page, ready to print, no account needed. Pick a level:
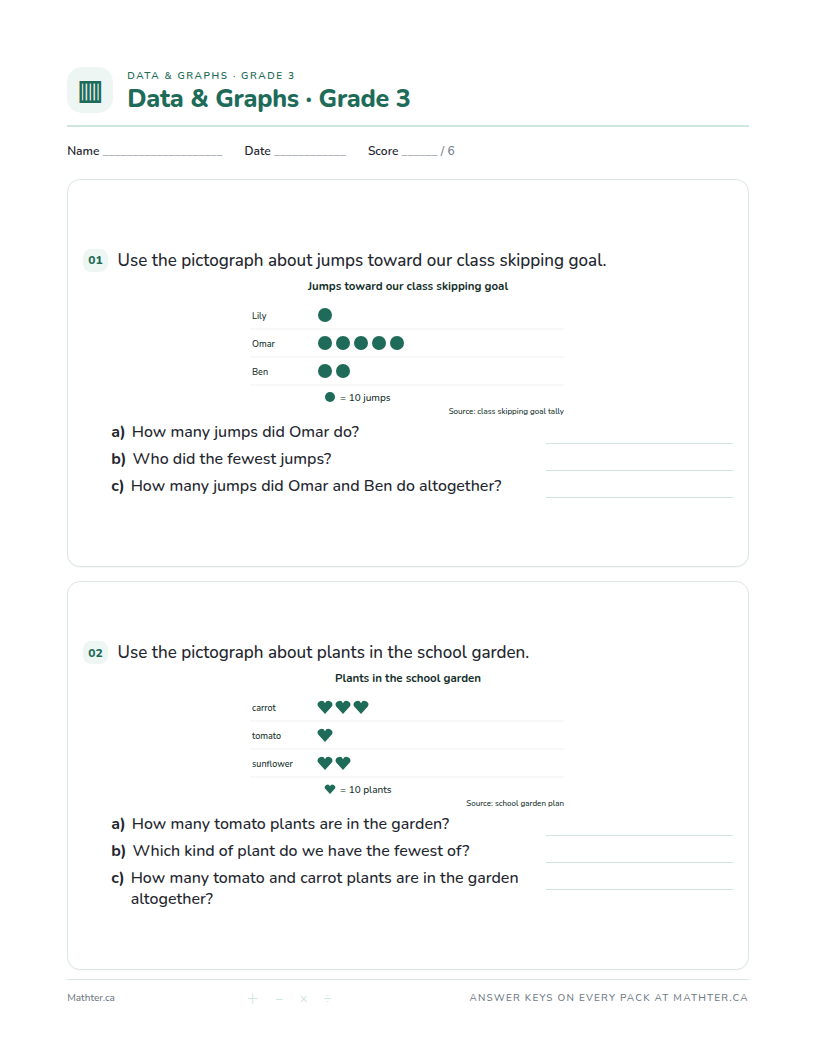
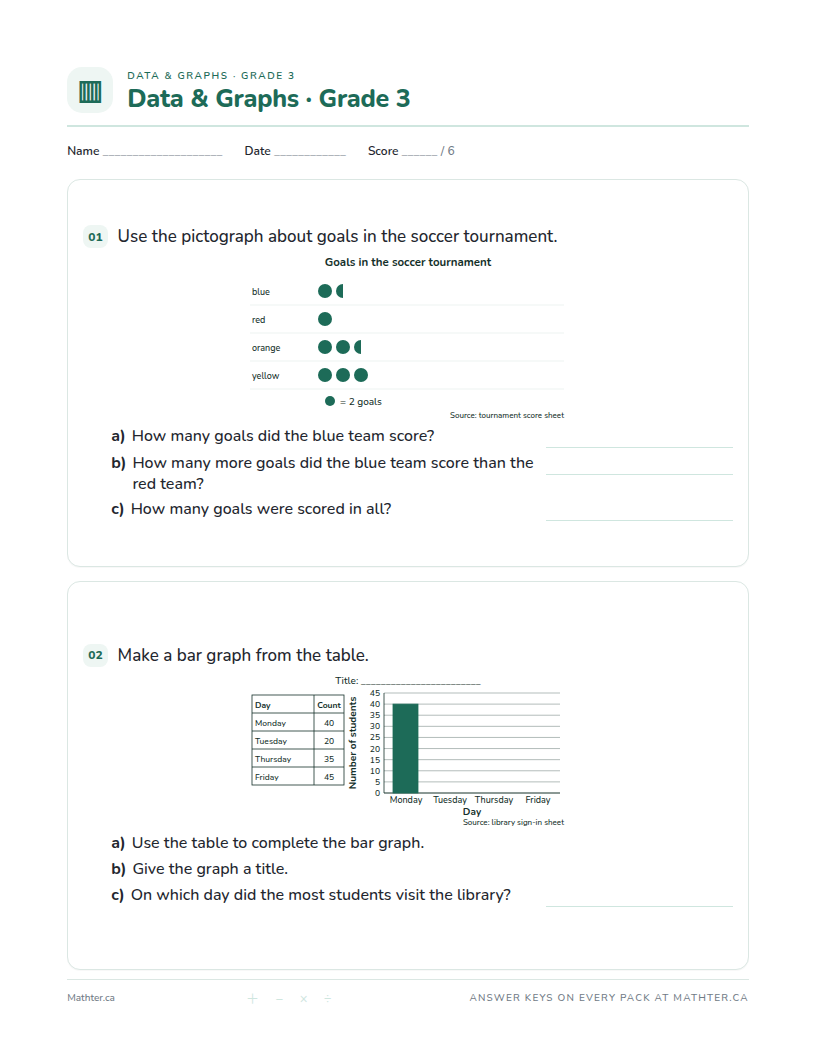
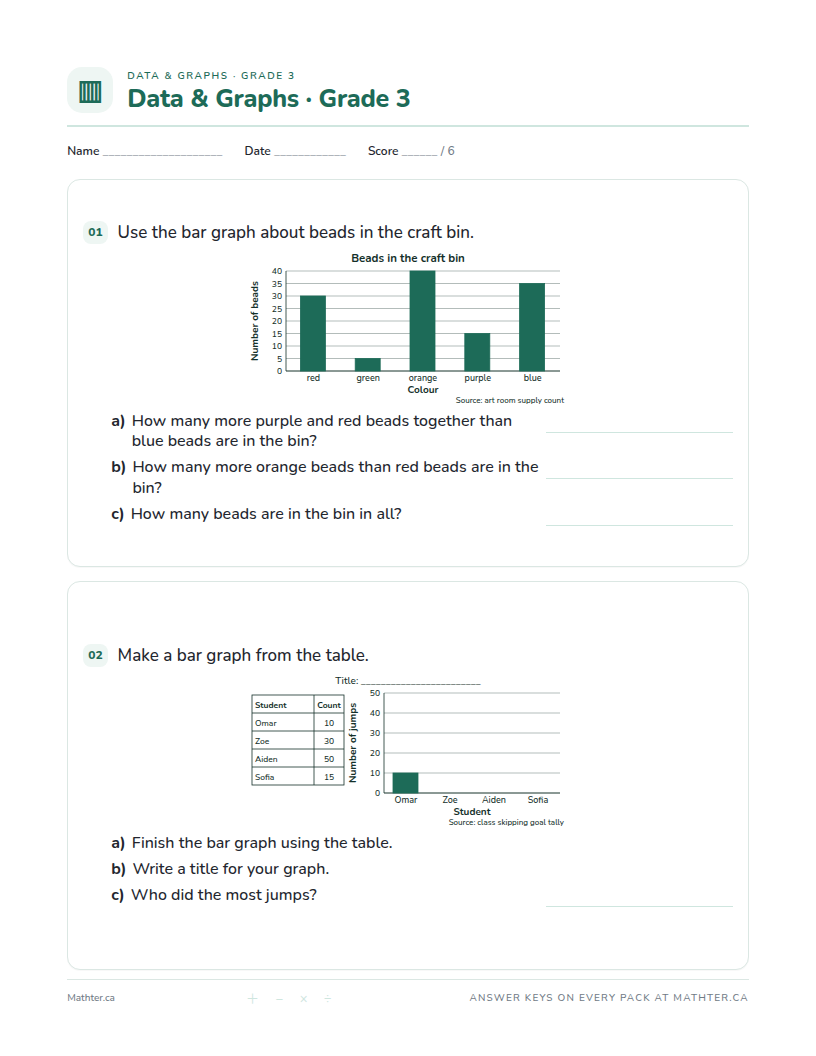
These three sheets are fixed, so you can bookmark or share them and get the same page back. Answer keys and fresh numbers come with a free account.
Why Grade 3 data & graphs practice matters
Ontario teaches data in every grade, and most of what children will ever read about numbers arrives as a graph. Reading the scale before the bars is the habit that stops a 1-picture-equals-2 pictograph from being read as half its real size.
Grade 3 sits between Grade 2 and Grade 4 in Mathter's data & graphs sequence, building on the earlier grade before Grade 4 extends it further.
Want the full method, tips, and common mistakes? Read the Data & Graphs Worksheets guide.
Frequently asked questions
- What's on a Grade 3 data & graphs worksheet?
- Each pack has up to 12 questions per page with a matching answer key, tuned to Grade 3, with beginner, intermediate, and advanced options so a teacher, tutor, or parent can match the learner's level.
- What is a pictograph?
- A graph that uses pictures. The key says how many each picture stands for; a half picture stands for half that many.
- What is the mode of a bar graph?
- The category with the tallest bar, the one chosen most often.
- How do you read a stem-and-leaf plot?
- The stem is the tens digit and each leaf is a ones digit, so 3 | 4 7 means 34 and 37.
Make a Grade 3 data & graphs pack
Pick your options and print in seconds, with answer keys included.
Create free worksheetsFree to start · answer keys included · free accounts get 14 days of Standard · no card required.